Touchscreen Software With Analytics Dashboard
Last updated: 12 May 2026
Most marketing teams have no idea how visitors actually behave at their booth, because they lack visibility into the real-time data. You’re standing there watching people swipe through your content, but you don’t know which product sparked genuine interest, how long they spent on each screen, or whether they actually engaged with your lead capture form. This invisible gap between foot traffic and measurable outcomes costs companies millions in missed opportunities and wasted event budgets every year. The good news is that touchscreen software with analytics dashboard capabilities solves this problem entirely, turning every interaction into actionable intelligence. This article will show you exactly how analytics-driven touchscreen platforms work, why they matter for your 2026 event strategy, and how to choose one that actually delivers measurable ROI. Read on to discover the game-changing metrics that separate winning booths from forgotten ones.
Key Takeaways
- Touchscreen software with integrated analytics dashboards lets you track visitor engagement, dwell time, and lead capture in real time during events.
- The most effective way to measure booth success is to track which content resonates, how long visitors spend on each screen, and which demographics convert to qualified leads.
- Analytics-driven touchscreen platforms eliminate guesswork by showing you exactly which products, videos, and interactive elements drive engagement and ROI.
- No-code touchscreen software now includes analytics dashboards at affordable price points, making real-time event data accessible to marketing teams of all sizes.
Why Analytics Matter in Touchscreen Software
For decades, booth success was measured by foot traffic count and a handful of business cards collected at the end of the day. You’d pack up, hope someone followed up, and never really know which elements of your booth actually moved the needle. Modern touchscreen software with analytics changes this entirely by automating the measurement of every meaningful visitor interaction. Every tap, swipe, video play, and lead submission becomes a data point that tells you what worked and what didn’t.
According to research from EXHIBITOR Magazine, interactive trade show booths achieve average dwell times of 5 to 12 minutes per visitor, compared to roughly 45 seconds for passive displays. That’s a 10–15x increase in the window your sales team has to start a meaningful conversation, but only if you know who’s spending time and on what. Booths with interactive screens draw 35% more visitors compared to traditional setups, and interactive displays can increase booth dwell time by 30–40% and lead capture by up to 35%. Without analytics, you’re flying blind in a sea of that data.
The real value emerges when you connect visitor behavior to business outcomes. Which product demo did the most visitors actually complete? Which video kept people engaged longest? Did the interactive map drive more interest than the product catalog? These questions can’t be answered by observation alone, and they shouldn’t have to be. Analytics dashboards built into www.popcomms.com blog articles and case studies show that teams using analytics-enabled touchscreen software see measurable improvements in follow-up conversion rates, sales cycle acceleration, and event ROI.
The Key Metrics You Should Track
Not all metrics are created equal. When you’re evaluating touchscreen software with analytics capabilities, focus on the measurements that directly connect visitor behavior to business results.
Dwell Time and Content Engagement
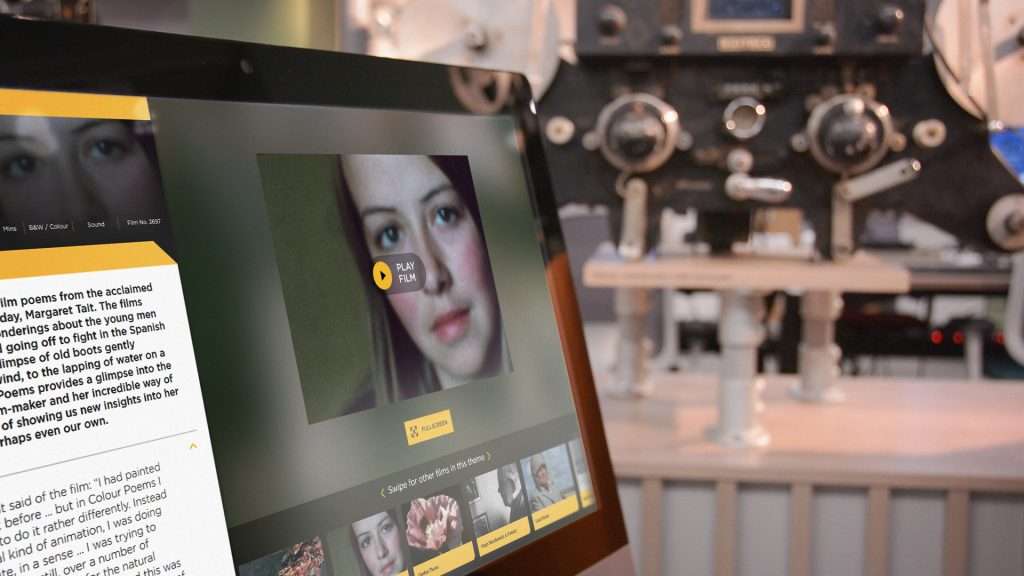
How long visitors spend on each screen tells you what resonates. If your hero product video plays for an average of 45 seconds out of 90 seconds, people are watching. If it’s consistently 5 seconds, they’re swiping past. The most effective way to optimize booth content is to measure which screens and videos hold attention longest, then expand those elements and remove underperformers. Dwell time by screen, by content type, and by demographic segment gives you the insight to refine your experience in real time, even mid-event.
Lead Capture Conversion
How many visitors actually submit their information? Touchscreen software should track what percentage of visitors reach your lead form, how many complete it, and at what point in the journey they convert. Some platforms show conversion funnels, so you can see if people drop off before entering email, or if they bail at the phone number field. This helps you streamline your form to increase completion rates.
Content Path and Navigation Flow
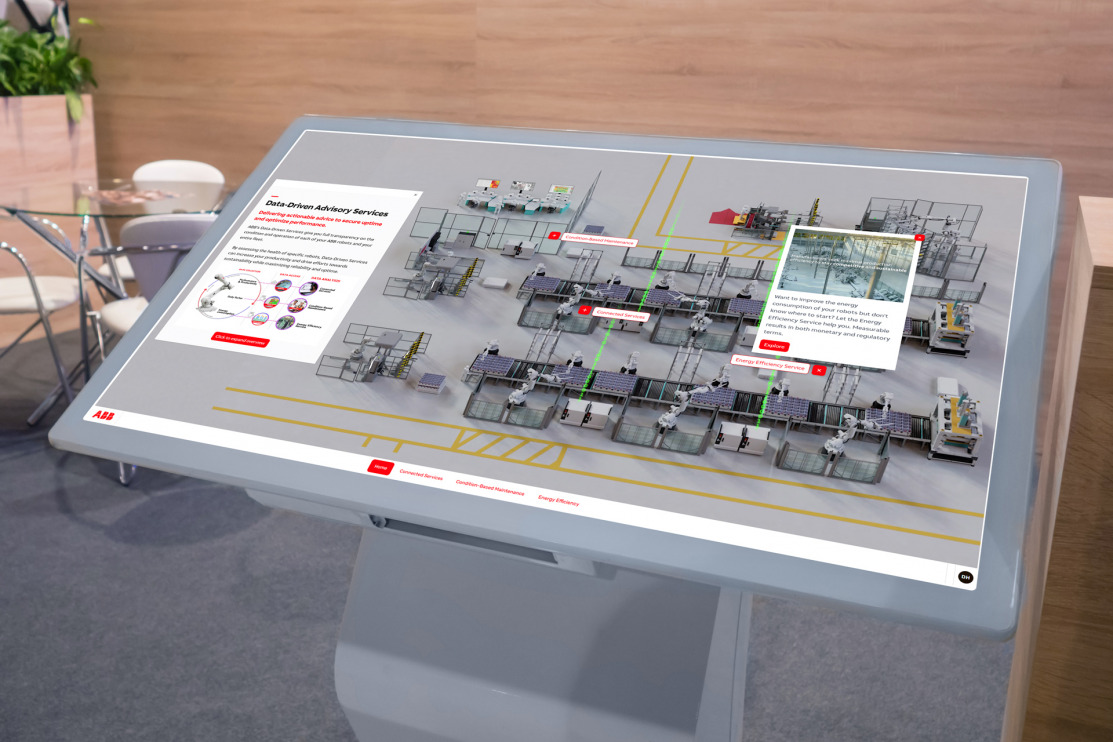
Which products or topics do visitors explore first? Do they follow a guided path or jump around freely? Do repeat visitors go directly to content they saw the previous day? Understanding navigation patterns reveals what captured attention and whether your information architecture makes intuitive sense. When visitors can browse content, explore products, and drill into detail at their own pace, without waiting for a rep to become available, the self-service touchscreen becomes a lead generation machine. The data shows you exactly how that machine is running.
Visitor Demographics and Segmentation
Advanced analytics dashboards let you tag visitors by role, industry, or interest category, then analyze behavior by segment. Did engineering visitors spend longer on technical specs than marketing visitors? Did international attendees engage differently with your content than domestic ones? These insights drive smarter follow-up and personalized sales conversations after the event.
Lead Quality and Downstream Conversion
The best analytics platforms integrate with your CRM, so you can track not just how many leads you captured, but which ones converted to opportunities, which ones closed, and which booths or content types generated the highest-value deals. This closes the loop between event activity and actual revenue.
Real-Time Data Collection and Lead Capture
Real-time analytics dashboards are not a luxury, they’re essential for adaptive event strategy. When you can see data as it’s happening, your team can adjust the experience mid-event, pivot messaging, or flag hot leads for immediate follow-up.
Imagine it’s day two of a three-day trade show. Your analytics dashboard shows that a particular product demo is underperforming, while an adjacent feature is drawing unexpected interest. Your team can quickly adjust screen layouts, highlight the winning feature, and reset visitor expectations by lunchtime. By day three, you’re capitalizing on real visitor demand instead of showing outdated assumptions about what matters.
Lead capture built directly into touchscreen software eliminates friction. Visitors don’t need to hand over a business card or wait in line. They simply fill in a form on the screen, and the lead goes directly to your system. Touchscreen software with lead capture tools can also send materials directly from the booth, so visitors walk away with your brochure, product spec sheet, or demo video link sent straight to their email. This immediate value exchange builds goodwill and dramatically increases follow-up engagement.
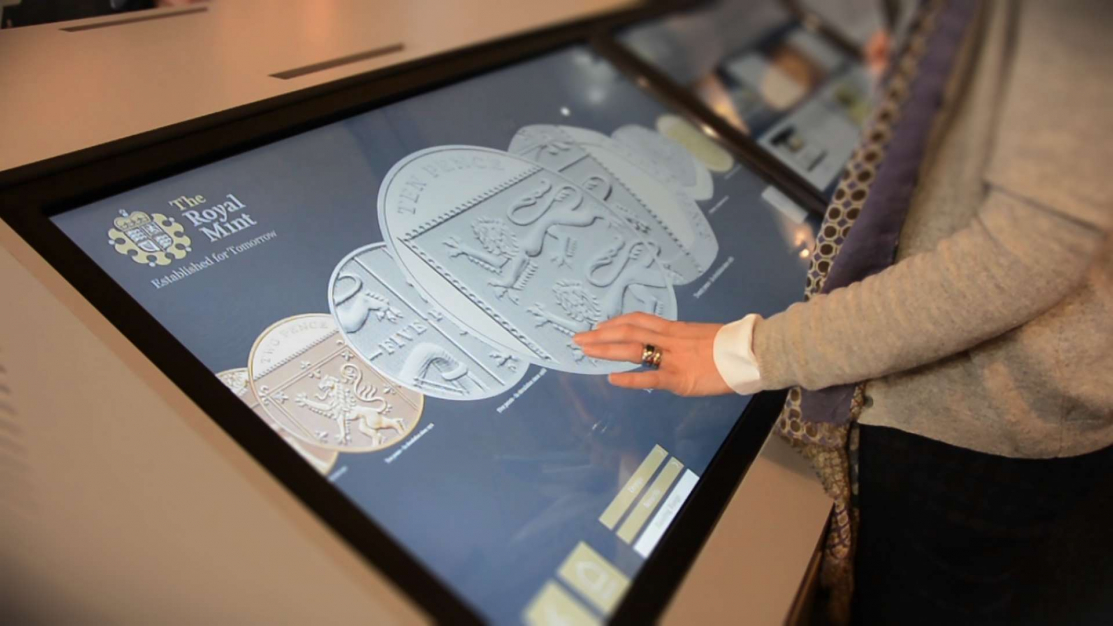
The self-service nature of touchscreens is a big part of why they work so effectively for lead capture. Interactive elements boost engagement between visitors and exhibitors by around 50%, and 81% of attendees remember booths that feature interactive touchscreens. When you combine that memorable experience with instant email delivery and analytics tracking, you’ve created a lead generation system that works 24/7 and captures data automatically.
How Analytics Improve Your Booth Performance
Understanding visitor behavior through analytics doesn’t just satisfy curiosity, it directly improves outcomes. Here’s how the feedback loop works.
Content Optimization
Once you know which content holds attention and which doesn’t, you can ruthlessly optimize. Remove the two-minute product explainer video that no one watches past 10 seconds. Add more interactive depth to the product comparison tool that 70% of visitors engage with. The data tells you what to keep, what to cut, and what to expand. Over time, your booth becomes a finely tuned engagement machine instead of a one-size-fits-all display.
Improved Sales Conversations
When your sales team knows exactly what a visitor engaged with before approaching them, the conversation changes. Instead of a generic pitch, you can say, “I saw you spent three minutes exploring our supply chain integration features. That’s exactly what I want to talk about.” This data-informed personalization converts 3–5x more often than cold outreach. It shows visitors you’re paying attention and care about their specific interests.
Smarter Follow-Up Campaigns
Post-event follow-up based on actual engagement is vastly more effective than blanket email campaigns. You can segment your leads by which content they engaged with, how long they spent at your booth, and what their stated role or industry was. Then send targeted follow-up emails that reference their specific interests, include relevant resources they didn’t download, and warm-start the sales conversation. Our services include guidance on leveraging analytics data for smarter post-event strategy.
Measurable Event ROI
For too long, event ROI has been hand-wavy and hard to prove. Marketing directors struggle to justify event budgets to finance teams because the connection between booth activity and revenue is opaque. Analytics change this entirely. When you can show that your booth generated 247 qualified leads, 68 of which entered the pipeline, 12 of which closed, and the average deal size was $145k, suddenly the event’s ROI becomes crystal clear. You can also compare booth performance year over year, or event to event, to understand which shows deliver the best return.
68% of trade show attendees believe booths featuring innovative technology have limitless potential, signalling that visitors actively expect and reward tech-driven experiences. When you combine that expectation with data-driven optimization, you’re not just meeting visitor needs, you’re exceeding them and measuring every moment of impact.
Choosing Touchscreen Software With Analytics Built In
Not all touchscreen software platforms include analytics. Some treat data tracking as an add-on, others bury dashboards behind complicated interfaces, and still others don’t capture the metrics that actually matter for your business. When evaluating options, look for these capabilities.
Real-Time Dashboard Visibility
Can you see live metrics while the event is happening? A good analytics dashboard updates in real time, shows visitor count, engagement heatmaps (which screens are busiest), lead capture volume, and top-performing content. You should be able to pull it up on a phone or tablet and see what’s happening at your booth from anywhere on the floor.
Offline Analytics That Sync
Most events have spotty or expensive WiFi. Your touchscreen software should work completely offline without any loss of functionality, and then sync analytics data once a connection is restored. This ensures data integrity and real-time performance, no matter the venue’s connectivity. Touchscreen software with offline capability is non-negotiable for events where you can’t rely on the internet.
Customizable Metrics and Export
Different industries and business models care about different metrics. A pharma company might want to track which disease state got the most engagement. A manufacturing firm might care about which equipment line sparked the most lead forms. Your software should let you define custom metrics, tag content intelligently, and export data in formats that feed into your CRM, analytics platform, or business intelligence tool. If it only offers pre-built dashboards with no customization, you’re limited to generic metrics that may not match your strategy.
CRM Integration
The best analytics platforms integrate directly with Salesforce, HubSpot, or other CRM systems. Leads captured on the touchscreen flow directly into your CRM, tagged with engagement data, content preferences, and interaction history. This eliminates double entry, ensures data accuracy, and lets your sales team access full context on each lead immediately.
Multi-Screen and Multi-Booth Tracking
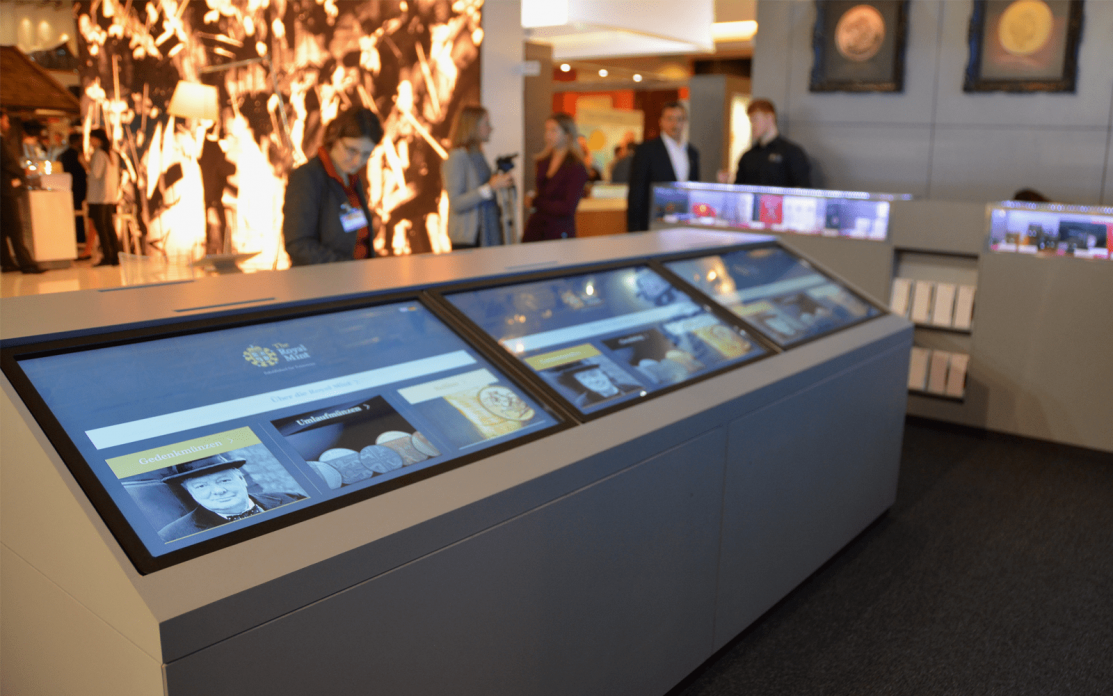
If you’re running four touchscreens across different booth areas or departments, you need a unified analytics dashboard that shows performance across all of them. You should be able to see total booth metrics, drill down into individual screen performance, and compare how different content strategies performed on different displays. This is particularly valuable if you’re testing variations or running A/B tests on messaging or layouts.
Implementation and Best Practices for 2026
Choosing touchscreen software with analytics is only half the battle. Implementation and ongoing optimization determine whether you actually see improvements.
Plan Your Metrics Before the Event
Don’t wait until you’re on the show floor to figure out what you want to measure. Before you even create your touchscreen experience, sit down with sales, marketing, and product teams and define your success metrics. What specific outcomes matter most? How many leads do you need to break even? What conversion rate are you targeting? Which products or features are strategic priorities? Bake these questions into your content tagging and dashboard setup so data automatically feeds into your success criteria.
According to industry best practices documented in EXHIBITOR Magazine’s event metrics guide, teams that define success metrics before an event achieve 40% better ROI than those that analyze results afterward.
Tag Content Intelligently
If your software allows content tagging, use it. Tag each video, product overview, and lead form screen with relevant metadata: product line, topic, difficulty level, target audience. This lets you slice and dice analytics by meaningful business dimensions instead of just raw screen names. When you can see engagement by product line or by audience segment, your optimization decisions become far more strategic.
Monitor and Adjust During the Event
Check your analytics dashboard at least twice a day, especially during day one and two of a multi-day event. Are there underperforming screens? Are visitors dropping off at a particular content screen? Is your lead form working as expected, or do people abandon it at a certain field? Make live adjustments: reorder screens, simplify forms, highlight winning content, or add context to confusing areas. The flexibility to iterate during the event is one of the biggest advantages of digital touchscreen displays over printed materials.
Prepare for Offline Scenarios
Even with planning, WiFi at events can fail. Choose software that’s built for offline environments from the ground up. Contact us if you want guidance on selecting platforms that prioritize offline-first design, real-time data sync, and zero lag regardless of connectivity.
Post-Event Analysis and Action
The real value of analytics emerges after the event. Export your data, review it with your team, and identify patterns. Which content resonated most? Which visitor segments are most likely to convert? Which geographic regions or industries showed the most engagement? Document these insights and use them to inform next year’s event strategy, product messaging, and sales training.
Case studies from teams using analytics-enabled touchscreen software show measurable improvements. As one director of marketing noted, “Tracking what materials were sent and opened afterward has been very useful for us. With four touchscreens, we could present four unique experiences across departments, which brought a lot of traffic and engagement to our booth.” This level of visibility and measurable ROI is now standard with modern platforms, and it’s completely achievable without expensive programming or technical expertise.
Frequently Asked Questions
What metrics should I track with touchscreen analytics?
Track dwell time per screen, lead capture conversion rate, content engagement by type, visitor demographics, and downstream sales pipeline conversion. The most effective platforms show real-time dashboards that display which screens are busiest, which content holds attention longest, and which lead forms complete at the highest rates. Integrate these metrics with your CRM so you can connect booth activity directly to pipeline outcomes.
How does touchscreen analytics improve event ROI?
Analytics connect visitor behavior to business results by showing which content, products, and booth experiences drive qualified leads and sales. Instead of estimating ROI based on foot traffic, you measure actual engagement depth, lead quality, and closed deals. Teams using analytics-driven touchscreen software typically see 30–40% improvements in lead quality and 3–5x faster sales cycles because follow-up conversations are data-informed and personalized.
Can touchscreen software with analytics work offline?
Yes, modern touchscreen software like POPcomms is built for offline use and includes full analytics functionality without internet. Data is collected and stored locally on the device, then automatically syncs to your dashboard once connectivity is restored. This ensures zero performance loss and complete data capture, regardless of event WiFi quality or availability.
How long does it take to set up analytics in touchscreen software?
With no-code platforms, analytics setup is straightforward and requires no programming. You define tags for your content, set up your dashboard widgets, and connect your CRM integration, typically in a few hours before the event. Most platforms offer pre-built dashboard templates optimized for trade shows, so you can get live analytics in minutes without building from scratch.
Which touchscreen software has the best analytics dashboard?
The best analytics dashboards are real-time, customizable, offline-capable, and integrate directly with your CRM. Look for platforms that show engagement heatmaps, conversion funnels, segment-based analysis, and multi-screen comparisons. Platforms designed specifically for trade show booths typically outperform generic kiosk software because they prioritize the metrics that matter for event ROI: lead capture, dwell time, and content engagement.
You now understand how analytics unlock real booth performance and ROI, but measuring isn’t enough, actually acting on those insights requires the right software platform.
Take the next step today.
Related Posts
Touchscreen Software With Offline Capability
Read
Why a Creative Strategy is Important When Developing an Interactive Touchscreen Experience
Read
7 Interactive Content Statistics | POPcomms
Read
How to Enhance Customer Experience with Interactive Touchscreens
Read